Published
cctop: reading a Claude Code Workflow run
A Claude Code Workflow run of mine lost most of its agents to rate limits, and every cost figure called it healthy. cctop v0.9.0 shows what the run was actually doing.

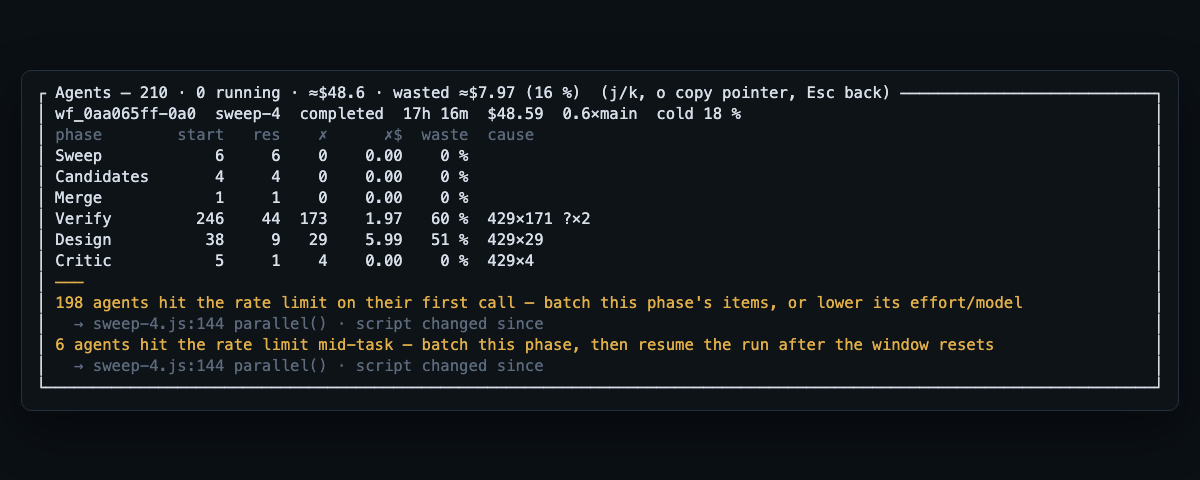
One of my Claude Code Workflow runs started 300 agents. 234 failed on rate limits, 198 of them on their first call, so they cost next to nothing. cctop v0.9.0 shows a run while it is live, gives a verdict per phase when it ends, and points each failure at the line in the script that caused it.
The run started 300 agents. 234 of them failed. Every failure was the same error: rate_limit, HTTP 429. And 198 of them died on their very first call.
That last number is the interesting one. An agent that dies on its first call has a transcript ten lines long. It read almost nothing and wrote almost nothing, so it cost almost nothing. Add up what the failures cost and you get a figure small enough to ignore. By that figure the run was healthy. It wasn't: the failures showed up in wall-clock time, in resumes and in results I didn't get. Just not in dollars.
I found this out by reading journal files by hand. cctop already had a panel for agent spend, and it could see every one of those agents. It could not say what the run was doing.
31 seconds, no sound: the live strip while a run fans out, then the verdict and its fix line. Every terminal frame is cctop v0.9.0's own output.
What a Workflow run is
A Claude Code Workflow is a script that fans a task out to many agents: phase('Verify'), then a parallel(…) or a pipeline(…) that starts one agent per item. Claude Code runs the script in the background, writes a journal line for every agent it starts, returns and loses, and tells the main session when the run ends.
Mine was a research sweep for cctop itself, six phases: sweep, candidates, merge, verify, design, critic. I rewrote the script three times during the run and resumed it after each rewrite. That is why there were 300 starts over 172 distinct agent calls: a resume retries what failed. And that is also why there were so many failures. The Verify phase started one agent per candidate, with nothing batching them.
What cctop shows now
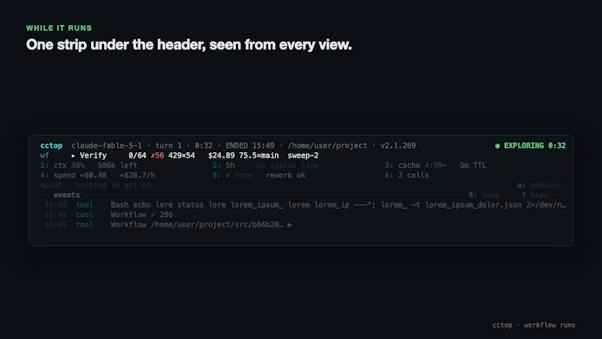
While a run is live, a second row appears under the dashboard's header:
wf ▸ Verify 0/64 ✗56 429×54 $24.89 75.5×main sweep-2The current phase. How many of its agents have returned out of how many started. How many failed and the main cause (429×54). What the run has cost so far, and how that compares with the main thread over the same time. The row sits in the header, not in a panel, so it is there whatever you have open. When the run ends, it goes.


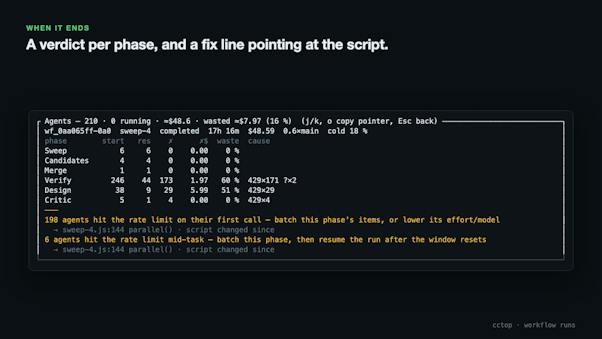
When a run ends, pressing Enter on it in the agents view opens a verdict, one row per phase: started, returned, failed as a count, failed as dollars, waste, and the cause.
Failed as a count and as dollars is the whole point. The dollar column alone tells you Verify was cheap. The count column tells you Verify is where the run fell over. I didn't want cctop to pick one of the two for me, because which one matters depends on what I was trying to get done. So it shows both, side by side, and says in its metrics docs that a first-call 429 costs roughly nothing: "read it with the count, not the dollars".

It also shows the run's cost as a ratio to what the main thread spent over the same window. That is a ratio, not a claim. cctop never says the main thread would have done the work more cheaply, because it has no way to know that.
A fix line, not a diagnosis
Every failed agent gets exactly one cause, taken from structural evidence only: the last error line's status and token, and whether the agent completed any call before it. Every cause maps to one fixed sentence. For my run:
198 agents hit the rate limit on their first call — batch this phase's items, or lower its effort/model
Under the sentence is a pointer: the parallel() or pipeline() call in the workflow script that started those agents, as file:line. cctop finds it by matching the phase and label prefix to the agent( call, then walking outward to the enclosing call. Press o and the pointer is on your clipboard.
The fix lines deliberately never say "lower the concurrency". A workflow has no per-call concurrency setting, so that advice would send you looking for a knob that doesn't exist. "Batch the items" is something you can actually do in a script.
Then came the part I didn't plan. By the time I had the tool, I had already fixed the script by hand. In the second version, Verify was one unbatched pipeline() over every candidate, at line 136. By the fourth, it was a parallel() over batches of five, at line 144. The run record Claude Code keeps holds only the last script. So the pointer lands on line 144, a call that is already the fix, and blames it for failures the old code caused.
That is a wrong answer delivered with confidence, which is the thing I least want a tool to do. So the pointer checks when the failures happened. If none of a phase's failed agents started under the current script, it still points, and says so:
→ sweep-4.js:144 parallel() · script changed sinceWhat it doesn't know yet
Only two causes have ever been seen on my machine: the 429, and a run I killed. The others it knows (an overloaded API, input too large, an agent that never satisfied its output schema) come from the error tokens Claude Code writes elsewhere and from the workflow runtime's documented behaviour. Each is covered by a synthetic test and none by a real workflow. If you hit one, I would like to see the output.
The live strip has been tested against a recorded run cut off mid-phase, not yet against a workflow started fresh with cctop watching. Those checks are written down as pending in the repo and stay pending until someone does them at a real terminal. Two questions about Claude Code itself are still open too. When is the run record first written: at launch, or only when a run ends? And does a resume add a second launch line to the journal? The answers change what cctop can show about a run in its first minutes.
The rules are the same as the rest of cctop. It is read-only. It keeps counts, timings, status codes and error tokens, and nothing anyone or anything wrote: not the prompts in the script, not what the agents returned, not the run's logs or summary.
Install
brew upgrade cctop                     # or: brew install tomstagl/tap/cctop
claude plugin marketplace update cctop
claude plugin update cctop@cctop       # then restart Claude Code
This is v0.9.0, tested with Claude Code 2.1.284. Start a workflow, and the strip appears under the header. When the run ends, open the agents view from panel 6 and press Enter on the run. cctop query agents returns the same verdict as JSON, and the in-Claude-Code pane draws it too.
The screenshots come from the anonymised fixture cctop tests against. It was built from this run, but it keeps a sample of the agents rather than all 300, so its per-phase counts are smaller than the ones above.
The repo is github.com/tomstagl/cctop. If a fix line tells you something wrong about your run, that is the bug report I want most.